A SaaS dashboard is where users decide whether the product is useful. It should help them understand status, take action, manage work, and trust the system. A dashboard that only shows decorative charts can look polished while failing the actual product workflow.
This guide covers SaaS dashboard development across metrics, permissions, API contracts, React UX, database performance, caching, exports, and launch readiness.
Start With Dashboard Jobs To Be Done
Before choosing charts or widgets, define what the dashboard must help the user do.
- Understand current account, project, campaign, order, billing, or workflow status.
- Find records that need attention.
- Complete common actions quickly.
- Spot errors, delays, or exceptions.
- Review progress over a useful time window.
- Export or share data only when users genuinely need it.
If the product scope is still forming, use the SaaS application developer checklist for founders first.
Choose Metrics That Support Decisions
Metrics should answer user questions. Start small and make sure each widget has a purpose.
- Status metrics: Open tasks, pending approvals, active users, failed jobs, unpaid invoices, or delayed orders.
- Trend metrics: Signups, usage, conversions, revenue, completion rate, response time, or campaign results.
- Operational metrics: Queue health, sync failures, import status, exception counts, or integration delays.
- Account metrics: Plan usage, limits, team activity, billing status, and storage or credit consumption.
A useful dashboard helps users decide what to do next, not just admire numbers.
Permissions And Visibility Rules
Dashboard data is often sensitive. Metrics, exports, billing panels, and admin controls should respect account and role boundaries.
- Scope every dashboard query by account, workspace, or organization.
- Show billing metrics only to allowed roles.
- Protect exports and downloads with backend permissions.
- Hide or disable unavailable actions in React after backend rules are enforced.
- Log sensitive dashboard actions such as exports, deletes, role changes, and billing updates.
For backend permission and API structure, pair dashboard work with backend API development.
API Contracts For Dashboard Widgets
Dashboard APIs should be designed as contracts, not one-off queries hidden behind each widget.
- Define response shapes for summary cards, charts, tables, alerts, and settings panels.
- Use consistent date ranges, filters, pagination, sorting, and empty states.
- Separate dashboard summary endpoints from record-management endpoints when needed.
- Return permission context when the UI needs to explain unavailable actions.
- Document expensive endpoints and caching expectations.
For a backend checklist, see SaaS product backend checklist for Laravel and Node.js.
React Dashboard UX
React dashboards should be responsive, readable, and clear under loading, empty, and error states.
- Use stable card, table, and chart dimensions so the layout does not jump while data loads.
- Show useful empty states for new accounts.
- Handle loading and error states per widget when possible.
- Keep filters visible and predictable.
- Make actions easy to scan without crowding the dashboard.
- Use tables for operational work and charts for trends where visuals help.
For frontend implementation, review React and Next.js development.
Database Performance For Dashboard Queries
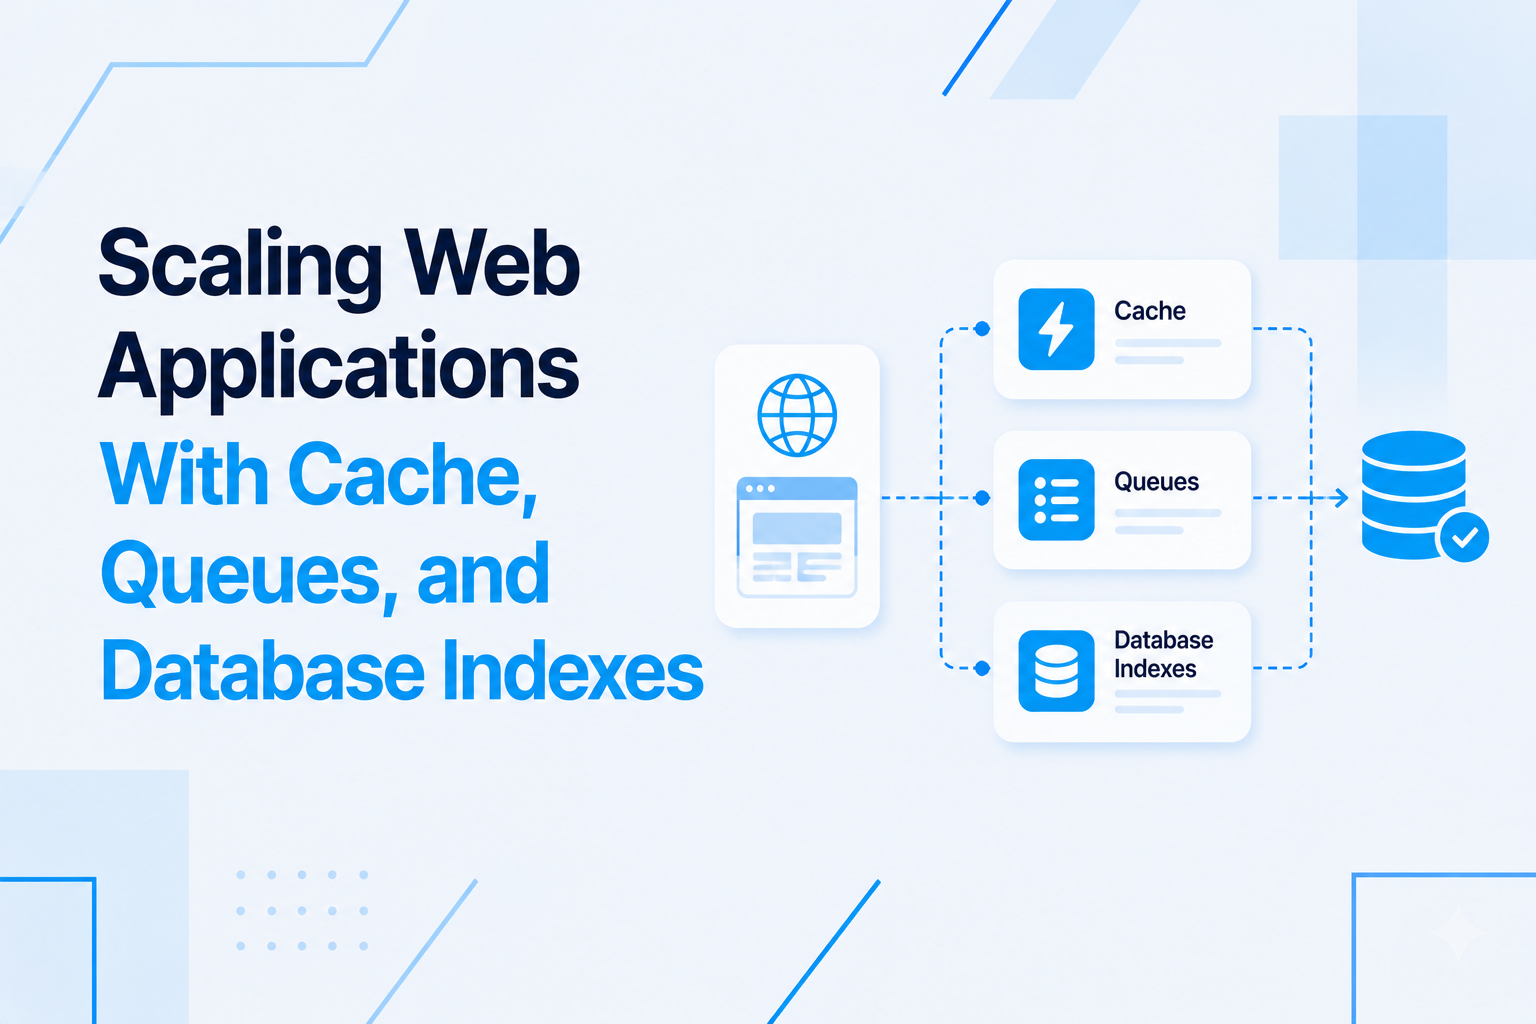
Dashboards can become the slowest part of a SaaS product because they often aggregate many records at once.
- Add indexes for tenant scopes, date filters, statuses, and common joins.
- Avoid repeated N+1 queries across widgets.
- Use summary tables for expensive recurring calculations.
- Move heavy exports and reports to background jobs.
- Measure query time before adding more widgets.
If dashboard performance is already a risk, include database design and optimization early.
Caching And Refresh Strategy
Not every dashboard number needs to be real time. Choose freshness based on the decision the metric supports.
- Use short cache windows for metrics that tolerate slight delay.
- Recalculate expensive summaries through scheduled jobs where needed.
- Refresh status widgets more often than historical charts.
- Use WebSockets only for workflows that genuinely need live updates.
- Make stale data states clear when accuracy matters.
For real-time dashboards, see React Node.js real-time app architecture.
Exports, Reports, And Background Work
Exports are often heavier than the dashboard itself. Treat them as backend jobs.
- Run large exports in queues.
- Notify users when files are ready.
- Expire exported files when they contain sensitive data.
- Audit who exported what and when.
- Protect reports with the same tenant and role rules as the dashboard.
Dashboard Launch Checklist
- Each metric supports a real user decision.
- Every query is scoped by tenant/account and protected by permissions.
- API contracts cover loading, empty, error, and permission states.
- Database indexes and slow-query risks are reviewed.
- Heavy reports and exports run through queues.
- Dashboard behavior is tested with empty, normal, and high-volume accounts.
- Monitoring tracks slow endpoints, failed jobs, and frontend errors.
If you need SaaS dashboard development, start with React dashboard development, backend API development, or full-stack SaaS product delivery.

Prakash Tank
Full-Stack Architect & Tech Enthusiast. Passionate about building scalable applications and sharing knowledge with the community.